

Rates, timeline and process: what to expect when working with a map illustrator.
When new clients reach out to me to discuss a map project, their first email usually follows the same pattern: a short description of the project, followed by the two big questions: how long will it take, and how much will it cost?
I believe our role as illustrators is not just about creating beautiful visuals, but also about being transparent and sharing knowledge. Clear communication builds trust, makes collaborations smoother, and help develop stronger long-term relationships with clients and peers.
That’s why I’ve put together this breakdown. It explains what’s involved in creating a practical or illustrated map. Here, you’ll find everything from workflow and tools, to timelines, deliverables, rates, and usage rights. My goal is to give you a realistic idea of what to expect if you ever consider working with a map illustrator like me.
1. A quick disclaimer
Before diving in, one important note: I’m an experienced illustrator and designer who specializes in maps, but I’m not a cartographer.
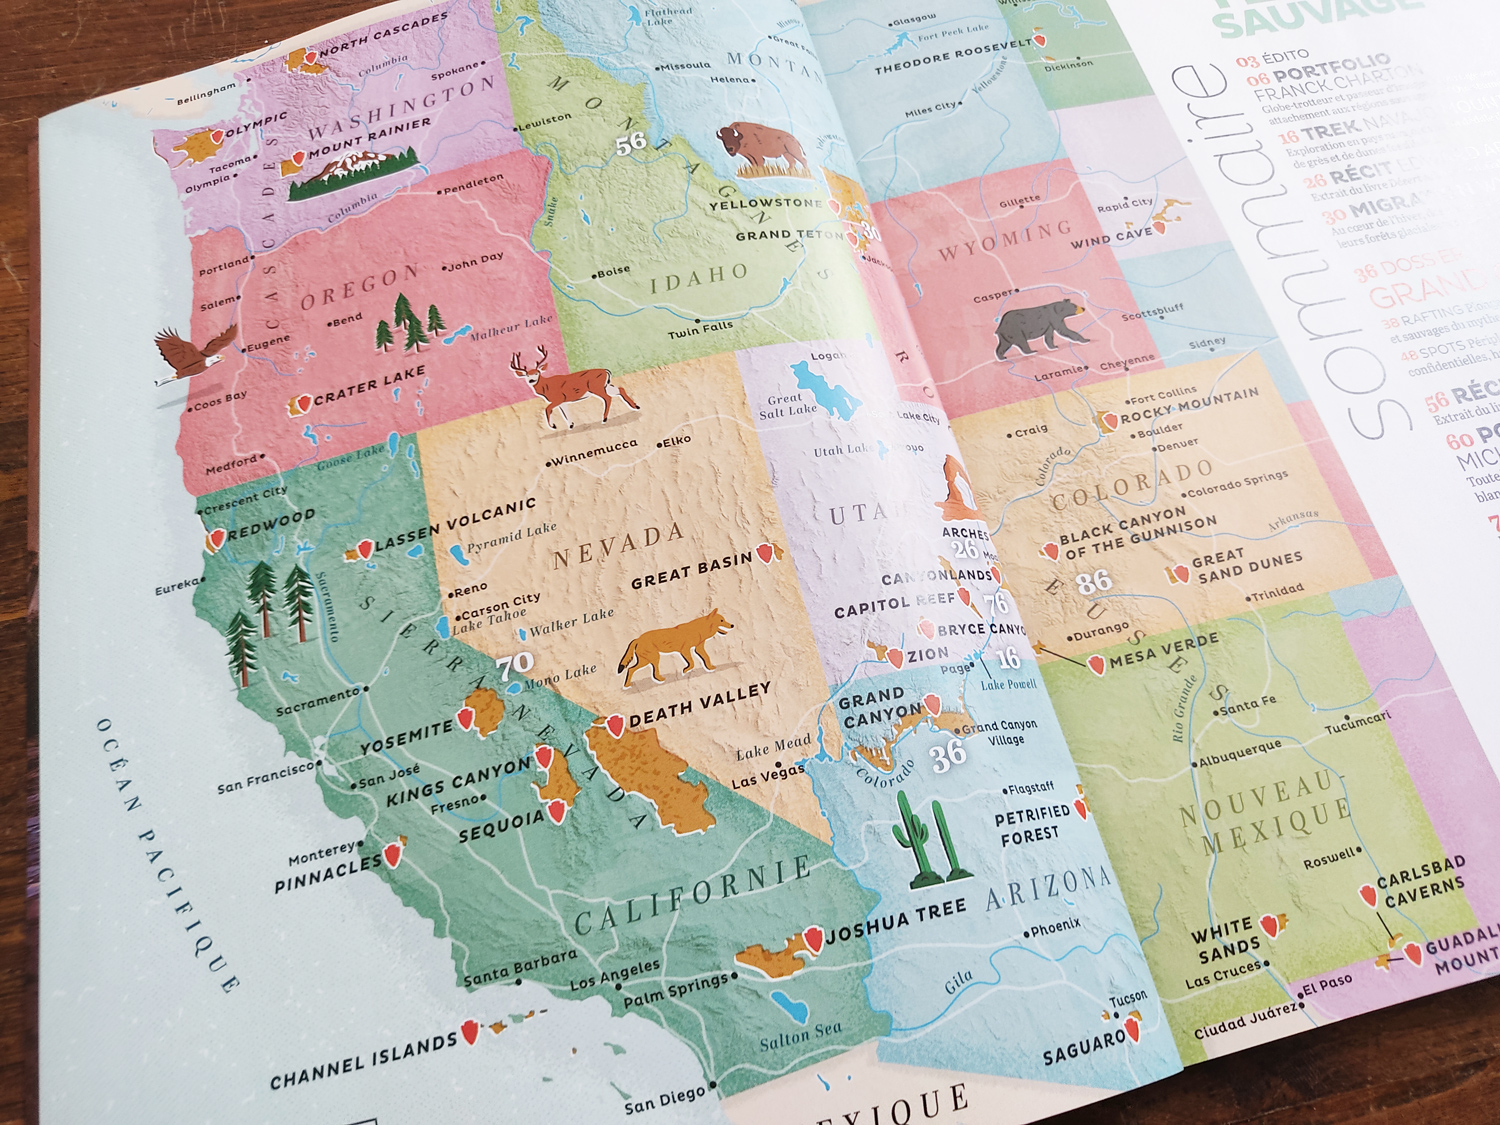
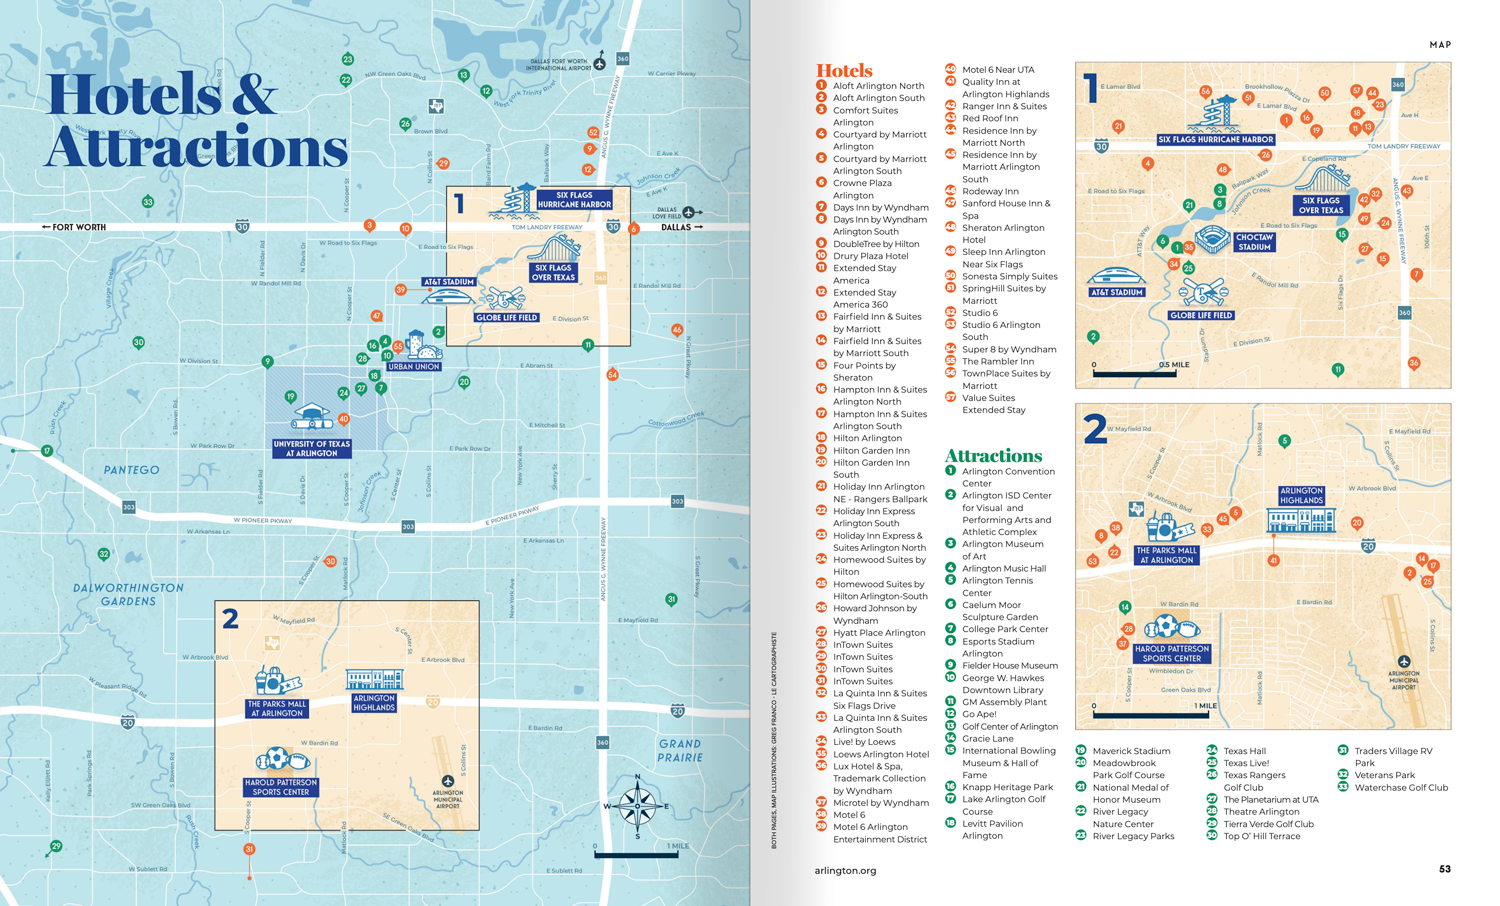
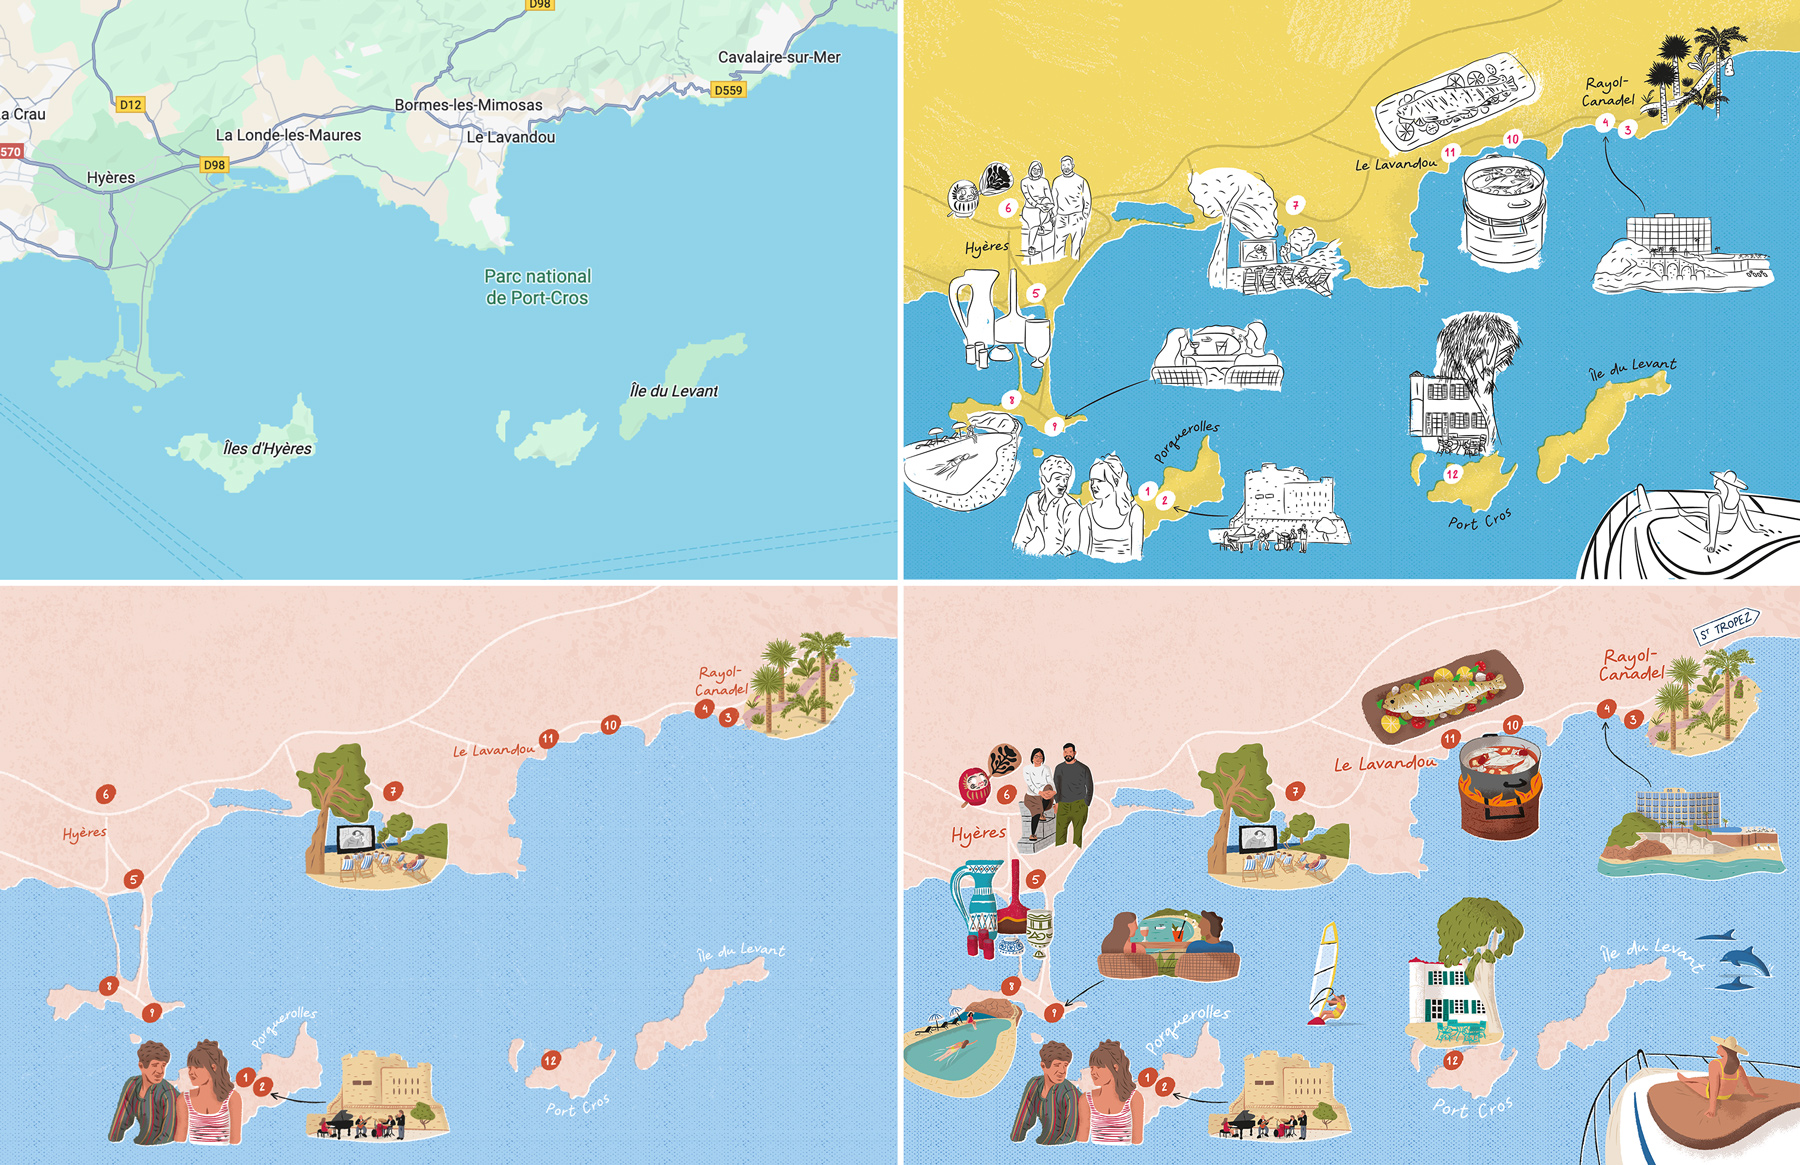
What does that mean in practice? I bring creativity and design to geography: using colors, typography, and hand-drawn iconography to turn a place into something engaging and easy to understand. Accuracy matters, of course, but clarity, style, and storytelling are at the heart of my work.
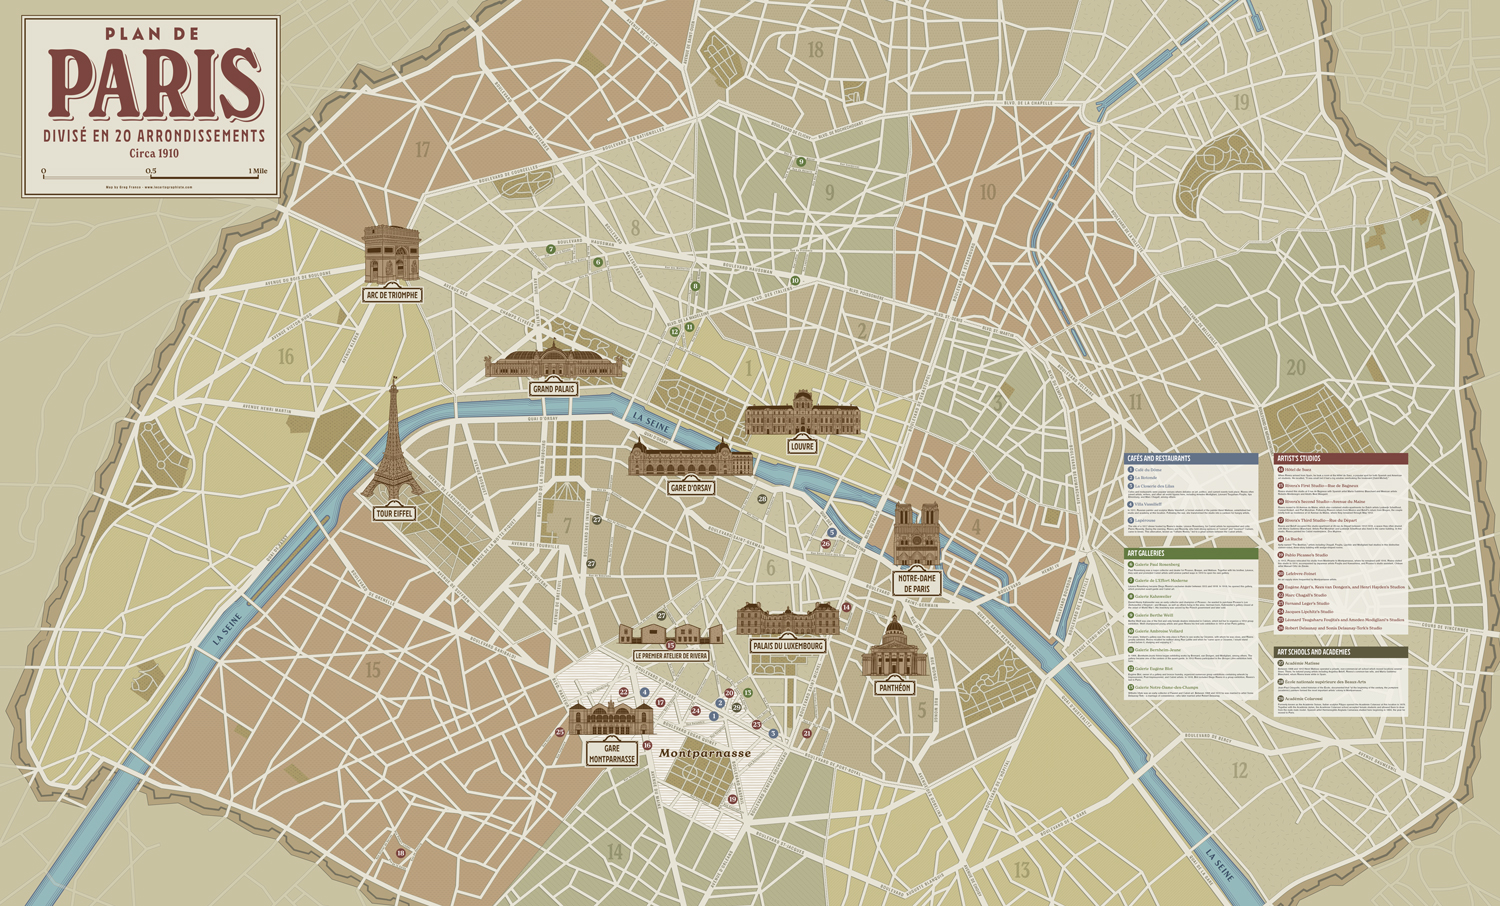
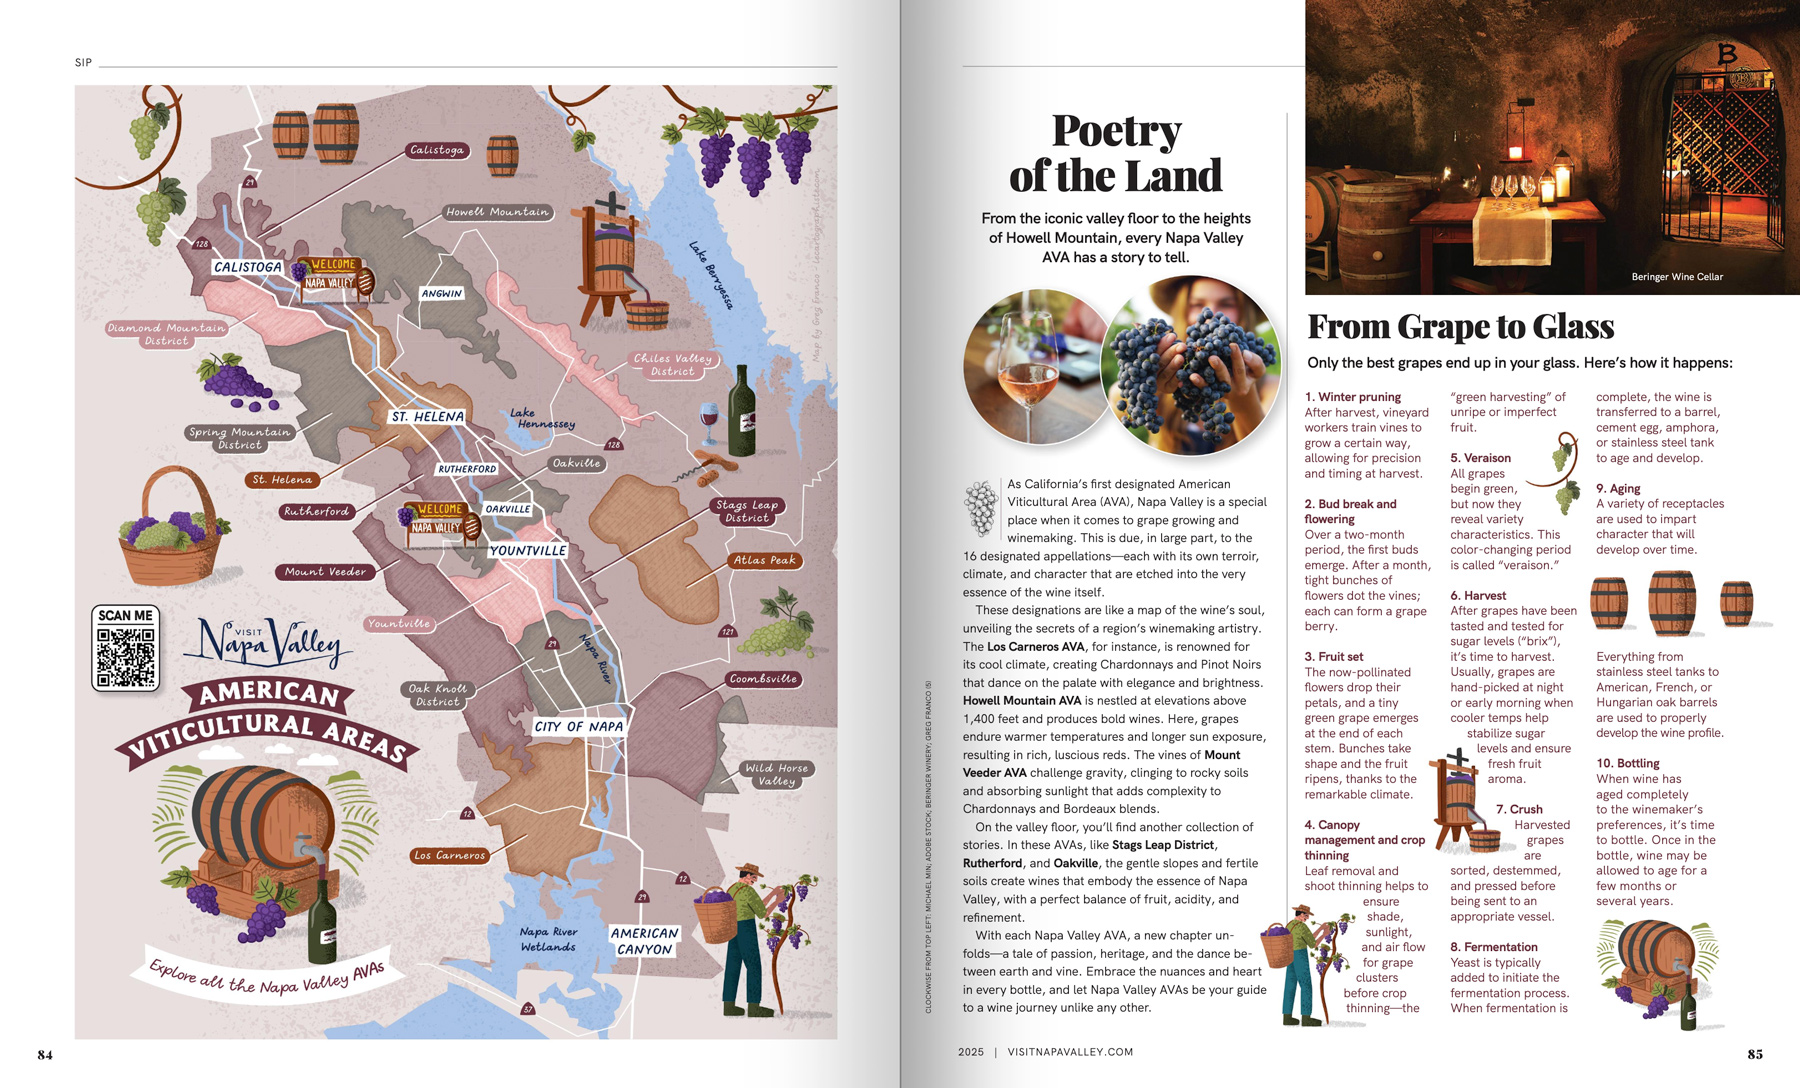
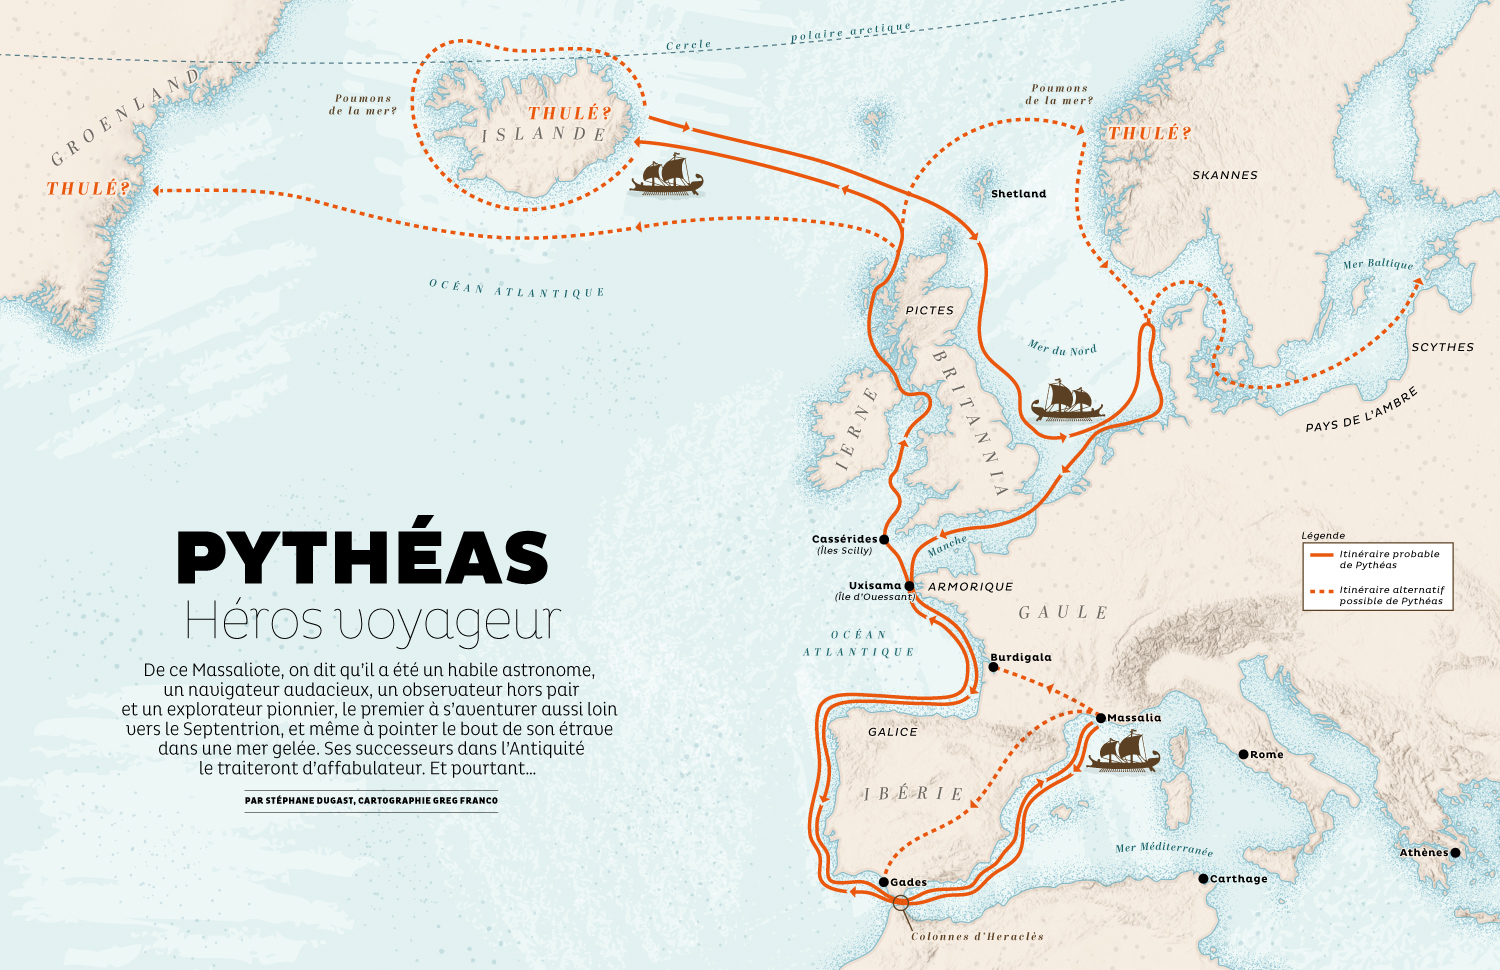
My maps are designed to tell stories, inspire exploration, and communicate information clearly. What I’m sharing here is my process which can differ from other illustrators.
2. Workflow: a collaborative process.
I see every map project as a collaboration. I’m not just “an extra hand on the mouse” executing instructions, but I also don’t impose my personal vision. Instead, it’s an exchange: I bring my expertise and my clients bring their deep knowledge of their audience and objectives.
Here’s how a typical project unfolds:
1. The brief
We start by defining:
- The area to represent (a Google Maps screenshot or a previous map is always helpful).
- The purpose of the map: wayfinding, editorial illustration, tourism promotion, book illustration, etc.
- The key points of interest: landmarks, attractions, buildings, routes, etc.
- The final size and medium (print in a visitor guide, website, mural, magazine spread).
2. References
If the client has photos of landmarks, brand guidelines, or style references, this is the moment to share them. These details help me ensure the map fits seamlessly into your project.
3. Framing and scale
Together, we decide the scale and boundaries of the map, always with an audience-first approach, making sure it’s clear, easy to read, and fit for purpose.
4. Defining the style
During the first drafts, we establish the visual style: should it be playful, editorial, elegant, or functional? This depends on the project’s purpose, the client’s brand identity, and sometimes the larger design direction (for instance, if the map is part of a magazine layout).
5. The creative process
In short: my process is iterative, transparent, and designed to avoid surprises. I usually work with three rounds of revisions, structured as follows:
- Draft (Milestone 1) → 1st round of feedback
- Design (Milestone 2) → 2nd round of feedback
- Refine (Milestone 3) → 3rd round of feedback
- Finalize (Milestone 4) → sign-off and delivery
That said, I don’t strictly wait for each milestone to share previews. In the early stages, frequent check-ins are crucial. There’s nothing worse than realizing too late that the framing or content isn’t aligned, which can cause frustration on both sides.
And if the project needs more milestones, this is also an open discussion as my goal is to complete the project with a fully happy client who’s proud of the final result.
3. Tools: how maps come to life?
All my maps are created in Adobe Illustrator, 100% vector-based, and entirely hand-crafted by me. I do not use AI-generated graphics in my work.
Depending on the type of map, I use different resources:
- Textures & details: custom Illustrator brushes for grain or to bring a hand-drawn feel.
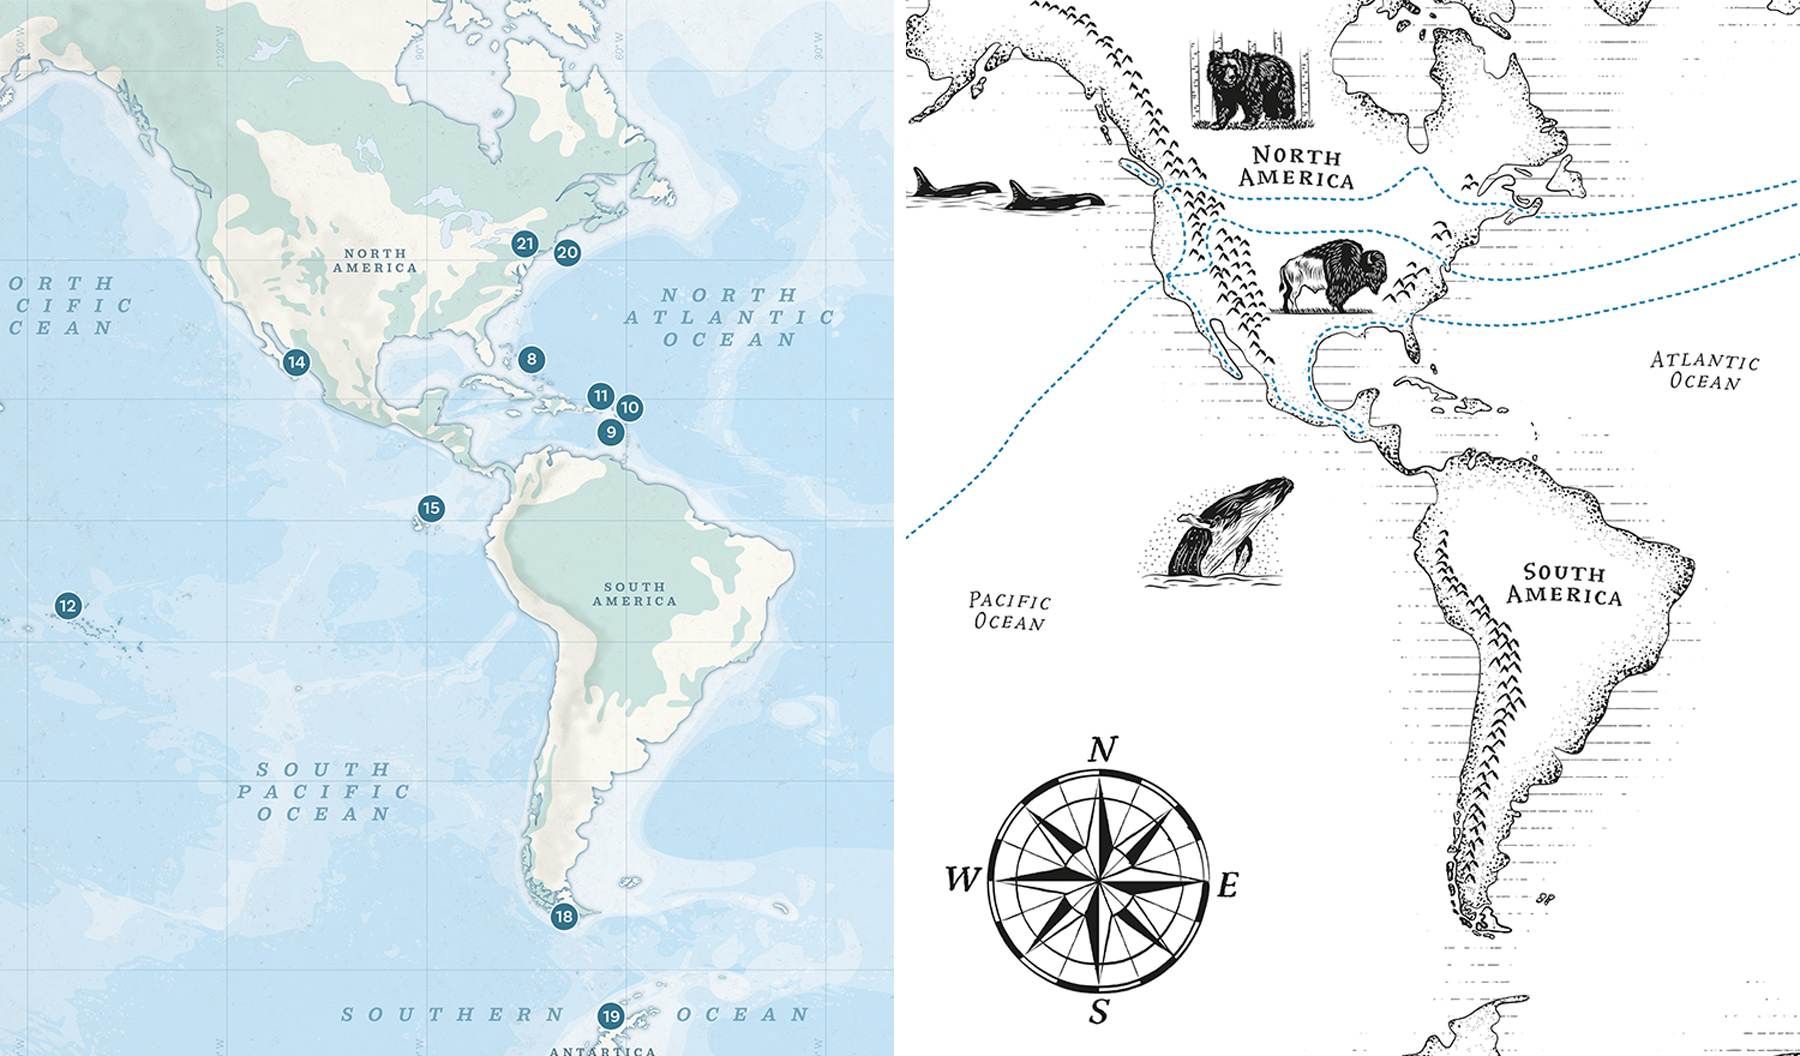
- Geographic accuracy: OpenStreetMap data for practical maps.
- Topography & bathymetry: open datasets from NASA Earth Data, GEBCO, and similar sources.
- Layout integration: Adobe InDesign when the map needs to fit into a specific layout.
Note: whenever open datasets are used, they are always acknowledged in the credits.
4. Deliverables: what type of files I provide.
I always provide industry-standard, high-resolution non-editable files (JPEGs or PDFs). These are perfect for print or digital use.
When agreed in advance, I can also provide:
- Editable Adobe Illustrator files (layered and clearly labeled).
- Other specific formats if required for integration into my client’s workflow.
5. Timeline: how long does it take to create an illustrated or practical map?
We now tackle the first big question! To be honest, timelines can vary widely, depending on:
- The number of maps to produce
- The level of detail required for a practical map
- The number of illustrations to include on an illustrated map
- Does it need custom or generic iconography
- How quickly feedback is provided (especially if multiple team members are involved in reviewing the designs)
Clients should also keep in mind that I usually juggle several projects at once so I may have limited availability at times.
As a general guide, a realistic timeline is typically 2 to 8 weeks.
If a client has a firm deadline, it’s best to be upfront from the start to discuss and plan the project accordingly. For a shorter turnaround, I also do my best to accommodate urgent requests whenever possible.
6. Usage rights: what’s allowed and not.
Usage rights define how you can use the map. This is an essential part of the discussion during budgeting and I’m always here to help the clients define usage rights.
Some clients (especially publishers) provide their own usage rights agreements. For others, here are the main questions to clarify:
- Promotional vs. commercial use
- Exclusive vs. non-exclusive rights
- One medium vs. multiple platforms
- Entire map use vs. extraction of elements (icons, illustrations)
- Limited-time usage (e.g. one campaign) vs. indefinite usage
Promotional usage rights will be mentioned on the initial quote I send to my clients and will be included in my rate. But if the map will be used on products and merchandise (posters, postcards, mugs, etc.), this usually requires a license agreement. Licensing is often structured as royalties (typically 5–15% of retail price) and fees vary depending on:
- Market reach
- Type of product
- Quantity produced
- Product lifespan
A full buy-out of rights is sometimes requested, but this means transferring all usage rights indefinitely, worldwide, and across all media. Because it’s such a broad grant of rights, it usually comes with a significant one-off fee.
The key point: rights are flexible, but they must be defined clearly to avoid misunderstandings. If the client needs to expand usage later, it can always be renegotiated.
Note: This is not legal advice and I invite you to seek advice from intellectual property experts in your country if you have any questions about usage rights as those may differ from one country to another.
7. Budget: How much does it cost to commission an illustrated or a practical map?
The BIG questions: what are your rates?
The honest answer: it depends. Probably not what you wanted to read!
Having a clear brief helps to provide a quote, this is why I always discuss the scope of work with my clients before sending a cost estimate, or accepting a project if they come with a specific budget already set. Here are a few key factors that influence the budget:
- Level of detail
- Number of maps
- Number of illustrations/icons
- Size and medium
- Timeline/urgency
- Usage rights
- Need for editable source files
I almost always provide a flat project rate based on the initial scope defined with the client. If the estimate is above the client’s budget, then the scope of work can be discussed and adapted to fit. But if new elements are added along the way, they may incur additional costs.
I rarely charge by the hour, except in specific cases (like extra revisions). And when I do, the hourly rate is discussed transparently with the client, depending on the project and what’s involved.
8. Conclusion
Commissioning a map isn’t just about “getting an illustration.” It’s both a creative and collaborative process that leads to the creation of a visual tool that serves a purpose, whether that’s guiding visitors, enriching a magazine story, or bringing a book to life.
By being upfront about workflow, tools, timelines, deliverables, usage rights, and budget, my goal is to avoid surprises and create a smooth, straightforward and enjoyable collaboration. Every project is unique, but the principles remain the same: good communication, creativity, and a shared vision.
When these elements come together, the result is more than a map, it’s an invitation to explore.
I hope this article helped clarify what to expect when working with a map illustrator. If you’d like to dive deeper into my process, check out my article on How to make an illustrated map step-by-step. And if you want a real-life example of how tourism boards can use illustrated maps to inspire visitors in practice, explore my article on what goes into creating an effective map.
If you have a project in mind, feel free to get in touch, I’d love to hear about it.
To learn more about me, visity my About page and if you want to explore more of my work: illustrated maps, practical maps or spot illustrations. You can also follow me on Instagram or subscribe to my newsletter for updates.
Greg Franco | Le Cartographiste